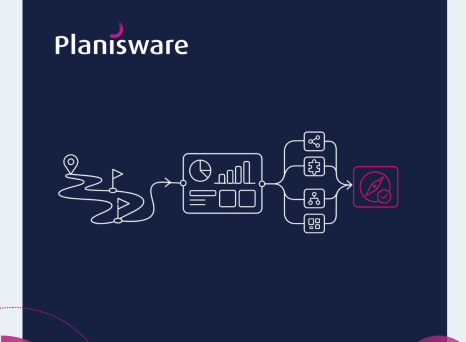
Strategic portfolio management (SPM) connects corporate strategy directly to operational delivery. It allows organizations to select, prioritize and steer investments so they maximize value and control risk.
Strategic portfolio management is the discipline of selecting, prioritizing and steering an organization's investments so that every initiative advances corporate strategy. It connects executive ambition to operational delivery through 7 steps: governance policy, selection criteria, capacity assessment, prioritization, performance measurement, adaptive execution and periodic review.
Organizations now have to decide and act with both speed and precision. A solid strategic portfolio management (SPM) process has become a genuine competitive lever. This article sets out 7 essential steps for building a portfolio governance framework that is adaptive, transparent and oriented toward measurable results.
Ground Portfolio Decisions in an AI-Powered Platform
Planisware is a global leader in project portfolio management (PPM) and strategic portfolio management (SPM). The company helps organizations and their project management offices (PMOs) strengthen governance and the alignment between strategy and execution. Its AI-powered cloud platform connects strategic priorities to operational decisions with strong control and security.
Planisware is recognized as a Leader in the Gartner Magic Quadrant for Adaptive Project Management and Reporting. Planisware is also named a Leader in the Forrester Wave for Strategic Portfolio Management. Approximately 600 of the world's leading organizations trust the platform. Its top 20 customers have maintained the relationship for an average of over 10 years. Each of the steps below can be supported, automated and steered through native platform capabilities, from turnkey adoption to highly configurable enterprise deployments.
Set the Investment Policy That Governs Every Decision
A clear investment policy is the foundation of strategic portfolio governance. This formal document states the objectives, the roles, the constraints and the risk appetite of the organization. It gives every portfolio decision the same reference point, which is what makes consistency and transparency possible.
A workable policy covers 4 things. It states the strategic objectives of the organization, the risk tolerance thresholds, the decision rights and escalation paths and the frequency of periodic review. The governance model itself varies with how the organization is structured.
| Type of organization | Initial decision | Periodic review | Risk escalation |
|---|---|---|---|
| Centralized | Investment committee | Quarterly | Executive management |
| Decentralized | Business unit leaders | Twice yearly | Central PMO |
Neither model is inherently better. The distinction that matters is whether decision rights are written down before the first arbitration, rather than negotiated during it. Planisware supports both structures through configurable workflows and full traceability of decisions.
Translate Strategy Into Measurable Selection Criteria
Strategic selection criteria turn a corporate vision into dimensions that can actually be measured: value, risk, impact and sustainability. They allow leaders to rank initiatives by their contribution to enterprise objectives rather than by the persuasiveness of the sponsor.
The criteria used most often include expected return on investment (ROI), strategic or technological value and a risk score. They also cover environmental, social and governance (ESG) impact and the degree of urgency or regulatory dependency. Each criterion needs a definition that 2 different reviewers would apply the same way.
A weighting model or scoring matrix then makes project proposals objectively comparable. Assigning a weight to each criterion, for example 20% to ROI and 30% to strategic alignment, forces the organization to state its priorities in advance. That is the point of the exercise. The weights encode the strategy, so the scoring simply applies it.
Test Portfolio Ambition Against Real Capacity
Capacity assessment compares investment demand against the resources that genuinely exist, whether financial, human or temporal. This analysis is what keeps the selected portfolio feasible rather than aspirational.
Capacity versus demand analysis rests on 3 activities. Teams map internal resources, model scenarios to test several investment combinations and detect bottlenecks over the short and medium term. Bottleneck detection is the step most often skipped, and it is usually where portfolios fail. A portfolio can be fully funded and still undeliverable if a single scarce skill sits on the critical path of 6 initiatives at once.
Planisware offers simulation capabilities that anticipate these constraints and adjust workload against operational reality. This approach gives leaders a defensible basis for prioritizing investments while optimizing the use of both human and financial capital.
Prioritize Investments and Allocate Resources With Confidence
Once capacity is known, initiatives are prioritized using quantitative methods that balance return against risk. Several approaches are available, and mature organizations tend to combine them.
| Method | Description | Primary objective |
|---|---|---|
| Risk budgeting | Allocation of overall risk across projects against defined ceilings | Control of aggregate risk |
| Risk parity | Even distribution of risk across portfolio components | Optimal diversification |
| Constrained optimization | Search for the best return and risk balance within limits | Value maximization |
Combining these methods with dynamic scenarios allows the portfolio to adapt quickly as markets move. The process runs from the submission of an initiative to its scoring, and then to the allocation decision. That sequence is what makes prioritization logical and transparent, because every step leaves a record of why an investment was funded. Planisware supports this logic through constrained optimization and data-driven scenario modeling.
Track Value Creation With KPIs and OKRs
Performance tracking rests on the combined use of key performance indicators (KPIs) and objectives and key results (OKRs). KPIs measure quantitative progress such as ROI, resource utilization or risk-adjusted value. OKRs connect those measures to broader qualitative objectives.
Combining the 2 frameworks gives leaders full visibility. OKRs steer strategic direction while KPIs anchor performance in fact. Used alone, OKRs drift toward ambition without evidence, and KPIs harden into activity reporting with no line of sight to strategy.
| Domain | Indicator | Purpose |
|---|---|---|
| Finance | ROI, benefit to cost ratio | Measure economic effectiveness |
| Resources | Utilization rate | Optimize capacity |
| Risk | Risk-adjusted value | Monitor portfolio resilience |
These indicators become the vital signs of a strategic portfolio and enable fast, informed adjustment. With Planisware, dynamic dashboards centralize them so that steering rests on unified data rather than reconciled spreadsheets.
Govern Execution and Absorb Uncertainty
Adaptive governance is the capacity to adjust decisions as the environment changes. It depends on active feedback loops: arbitration committees, capable PMOs and real-time tracking tools. Without those loops, a governance model simply records decisions that the market has already overtaken.
Recognized practices include frequent review of priorities, modeling of alternative scenarios, and continuous communication between strategic and operational teams. Each of these shortens the distance between a signal and a decision.
Managing uncertainty at portfolio level requires control mechanisms distinct from those of a single project. A project manages variance inside a fixed scope. A portfolio manages the option to change scope entirely, which is a different discipline. The objective is to keep steering rigorous while remaining responsive, and that balance is the mark of a mature SPM governance model. Planisware supports this adaptability through consolidated visibility and AI-driven forecasting.
Measure, Review and Compound the Learning
Periodic review consolidates what the organization has learned and feeds it into future planning. Semiannual or annual cycles allow leaders to compare actual performance against original objectives and adjust the investment plan accordingly.
Measurement criteria include financial indicators such as ROI, the benefit to cost ratio and net present value. They also include non-financial indicators such as sustainability, environmental impact and net-zero alignment. A standardized review grid keeps the comparison honest from one cycle to the next.
The practical value of this discipline shows up in operational terms. ADNOC Technology is the technology arm of the UAE energy group. It moved from a portfolio managed across spreadsheets, emails and shared drives to a single governed platform in Planisware. More than 300 active users now work in the platform. Executive-level reports that once required manual consolidation are generated at the click of a button. Asma Al Haddabi, Vice President for Technology Strategy Planning and Portfolio Management at ADNOC, leads the portfolio governance model that made this possible. The consolidated dataset now also underpins the organization's AI and machine learning ambitions, because reliable historical project data is the precondition for both.
That is the compounding effect worth designing for. Each review cycle improves the data, and better data improves the next decision. Strategic portfolio management becomes a durable engine of value creation and organizational resilience rather than a reporting obligation. To assess how your own portfolio governance compares, explore the strategic portfolio management resources at planisware.com.
Frequently Asked Questions
What resources can I consult for more information about strategic portfolio management?
The following Planisware resources go deeper on the steps, frameworks and metrics covered in this article:
- Strategic Portfolio Governance Best Practices for 2026 Leaders: how leaders align investments, resources and priorities with agility, which extends the governance and policy step above.
- Executive Guide to Strategic Project Portfolio Management: an executive-level view of connecting strategy to delivery, useful for framing the business case with the C-suite.
- Strategic Portfolio Management Tools, Software and Solutions: the platform capabilities that operationalize each of the 7 steps described here.
- 10 Metrics for Evaluating Strategic Project Performance: a practical metric set that complements the KPI and OKR step of this article.
- The Ultimate Guide to OKRs for Project and Portfolio Management: how to structure objectives and key results so they connect to portfolio decisions.
- 5 Best OKRs to Start Measuring the Impact of Strategic Portfolio Management: a starting set of OKRs for organizations formalizing portfolio measurement.
- 6 Core Components of Project Portfolio Management: the foundational building blocks that sit beneath a strategic portfolio process.
- Optimizing Resource Management Across Projects: mapping, prioritization and workload forecasting, which directly supports the capacity assessment step.
What is strategic portfolio management and how does it differ from traditional project management?
Strategic portfolio management is the discipline that connects corporate strategy to operational execution by selecting, prioritizing and steering investments across the whole organization. Traditional project management concentrates on delivering a defined scope within schedule and budget. SPM takes a cross-cutting view of the entire investment base.
| Dimension | Traditional project management | Strategic portfolio management |
|---|---|---|
| Scope | A single project | Every initiative in the organization |
| Primary objective | Delivery within constraints | Value maximization and strategic alignment |
| Time horizon | Short to medium term | Medium to long term |
| Decision makers | Project manager, PMO | Executive management, C-suite, investment committees |
The practical difference is the question each discipline answers. Project management asks whether the work is being done correctly. Portfolio management asks whether it is the right work at all. Both matter, and neither substitutes for the other. Organizations that formalize the portfolio layer gain the ability to stop initiatives, not only to deliver them. Planisware is named a Leader in the Forrester Wave for Strategic Portfolio Management. The executive guide to strategic project portfolio management sets out how the 2 layers connect in practice.
Which capabilities should a strategic portfolio management platform provide?
A platform that genuinely supports SPM has to cover the full decision cycle, not only reporting. The mapping below links each step of the process to the capability that makes it repeatable.
| SPM step | Associated platform capability |
|---|---|
| Objective definition | Modeling of strategic criteria and weighting of priorities |
| Portfolio assessment | Consolidated dashboards and automated project scoring |
| Prioritization | Scenario simulation and budget what-if analysis |
| Resource allocation | Real-time capacity management and overload detection |
| Monitoring and adjustment | Automated alerts, executive reporting and continuous review |
Integration deserves particular attention. A portfolio platform that cannot ingest financial actuals from the enterprise resource planning system will always report on stale numbers. ADNOC Technology, for example, feeds project spending and budget updates directly from SAP into Planisware so that governance rests on current data. Explore the full capability set for strategic portfolio management and the supporting resource management and capacity planning approach.
How long does it take to establish a strategic portfolio management process?
Establishing a working SPM process is a phased effort rather than a single deployment, and the pace depends on governance maturity more than on technology. A realistic sequence runs as follows:
- Agree the investment policy, decision rights and escalation paths. This is a governance conversation, and it is usually the longest step because it settles who decides what.
- Define and weight the selection criteria, then test them retrospectively against decisions the organization has already made.
- Inventory the existing portfolio and establish a reliable baseline of cost, resource and status data.
- Run the first prioritization cycle on a limited scope, such as a single business unit or function.
- Extend the model across the organization once the cycle has proven itself.
Phasing matters more than speed. ADNOC Technology adopted a phased launch, starting with the technology function and expanding as adoption grew. Data migration and user onboarding were deliberately paced to prioritize quality. Internal champions cascaded knowledge across teams, which is what carried the organization past initial resistance. For the underlying building blocks, see the 6 core components of project portfolio management and the proven best practices for portfolio management adoption.
Who should sit on the portfolio investment committee?
Committee composition determines whether arbitration is strategic or political. The membership has to carry enough authority to reallocate funding and enough operational insight to judge feasibility.
- An executive sponsor with the authority to stop initiatives, not only to approve them. Without this, the committee becomes an approval queue.
- The chief financial officer or a finance representative, so that portfolio decisions and budget cycles stay connected rather than running on separate calendars.
- Business unit leaders who own the demand and can defend the value case for their initiatives.
- The PMO, which supplies the consolidated data, the scoring and the institutional memory of previous cycles.
- A risk or compliance voice where regulatory dependency is a scoring criterion.
Cadence matters as much as composition. Centralized organizations typically review quarterly, while decentralized ones often move to a twice yearly rhythm with delegated interim decisions. The strategic portfolio governance practices resource examines how leading organizations structure these forums and keep them decisive.
How can an organization prove that strategic portfolio management is working?
Proof comes from a balanced scorecard rather than a single figure. Four categories give executives a complete picture of whether the discipline is producing results.
| Category | Key indicators | What they measure |
|---|---|---|
| Financial value | Portfolio ROI, net present value, benefits realization rate | Return on committed investment |
| Strategic alignment | Share of projects mapped to priority objectives | Coherence between portfolio and ambition |
| Operational performance | On-time delivery rate, budget adherence | Execution effectiveness |
| Risk management | Share of high-risk projects, critical incidents | Control of risk exposure |
A useful leading indicator sits outside this table: decision latency, meaning the elapsed time between a performance signal and the reallocation decision it triggers. Organizations that shorten it are governing adaptively. ADNOC Technology illustrates the shift, having moved from manual reporting across group companies to executive reports produced on demand. To build the measurement layer, start with the 10 metrics for evaluating strategic project performance and the 5 best OKRs for measuring portfolio impact.