In 2026, PMO KPIs must directly support corporate strategy and enable proactive decisions instead of just tracking activity. This article highlights eight core metrics: from benefits realization, strategic alignment, and ROI to cost and schedule performance, resource utilization, risk response time, stakeholder satisfaction, and PMO maturity. Together, those KPIs form a lean, strategy‑centric KPI set for a value‑driven PMO.
Why PMO KPIs must be rethought for 2026
- Strategy-centric: KPIs must directly demonstrate their contribution to corporate objectives, from project outputs through to realized benefits (PMO metrics with clear strategic impact).
- Automated: Data from core systems should be continuously consolidated to avoid manual gaps and reporting lags.
- Predictive: Leading indicators and forecasts should replace “end-of-month surprises” with fact-based, proactive decisions.
Top 8 KPIs at a glance
| KPI | Short description |
|---|---|
| Benefits Realization | Share of planned benefits that have actually been achieved. |
| Strategic Alignment | Degree to which projects and objectives directly support corporate strategy. |
| Return on Investment (ROI) | Ratio of benefits to costs to assess investment attractiveness. |
| Schedule performance & on-time completion (SV & On-time Completion) | Schedule performance and on-time delivery. |
| Resource utilization | Efficiency of capacity usage and early warning for overload. |
| Risk response time | Time from risk identification to the first mitigation action. |
| CSAT & stakeholder satisfaction | Satisfaction with outcomes and process as a key acceptance lever. |
| PMO maturity | Structured measure of the PMO’s capability, standards, and steering quality. |
Note: KPIs should be SMART and backed by clear thresholds to trigger action instead of debate.
Image
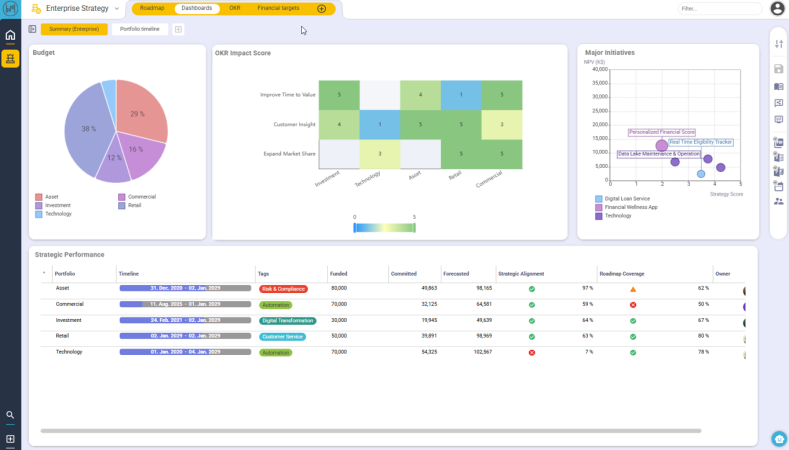
Benefits Realization
Benefits Realization measures how much of the planned benefits have actually been achieved. It shows whether projects and initiatives provide concrete contributions to corporate goals and makes the PMO’s value visible. Unlike classic output metrics, Benefits Realization focuses on real outcomes, the actual added value for the organization.
How Planisware supports this
- Structured capture of benefits: Assumptions, milestones, and expected effects are stored centrally.
- Shared data foundation: Progress and changes are transparent for all roles.
- Clear dashboards: Benefit targets, progress, and critical variances are easy to read.
- Scenario comparison: Different project or budget options can be compared by expected benefits.
- Continuous monitoring: Teams can see early when benefits are at risk and take corrective action.
Image
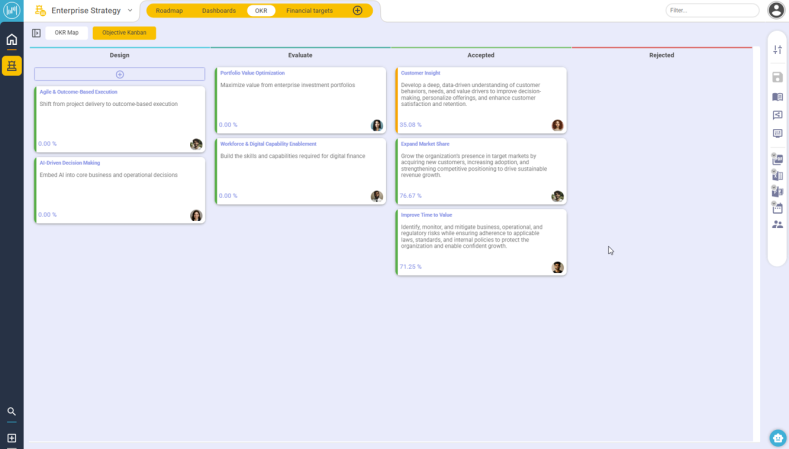
Strategic Alignment
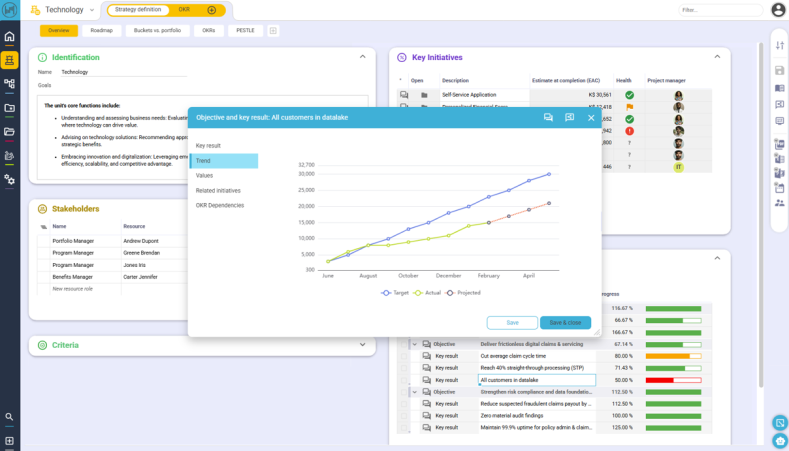
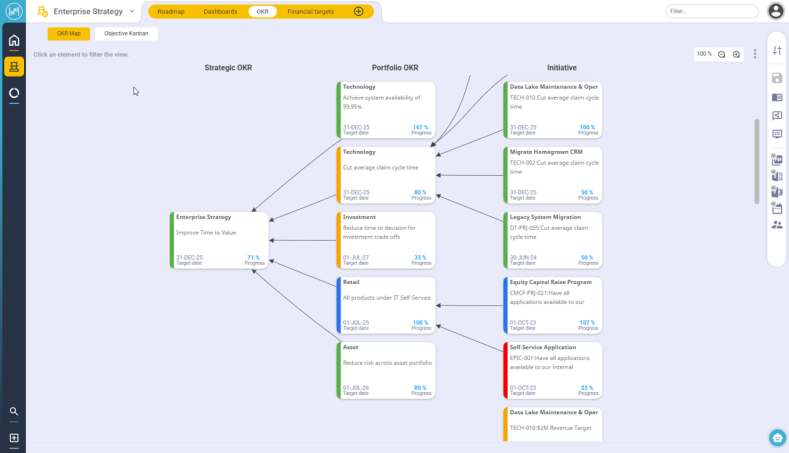
Strategic Alignment shows how strongly projects support corporate objectives. A high strategic contribution means the portfolio is well-prioritized and resources are deployed where they generate the most strategic value.
How Planisware supports this
- Model goal structures: Corporate goals or OKRs can be captured centrally and linked to projects.
- Filter projects by strategic contribution: Initiatives can be sorted by relevance, benefits, or risk.
- Automatically updated portfolio views: Reports adjust as priorities change.
- Visual summaries: Simple visuals show strategic contribution and portfolio focus at a glance.
Image
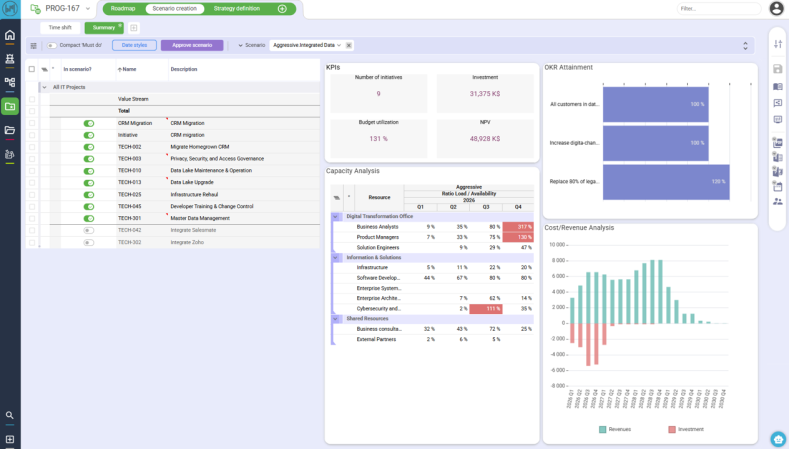
Return on Investment (ROI)
ROI describes the ratio between a project’s expected benefits and the costs invested. A high ROI indicates value-creating investments and supports portfolio decisions and efficient resource use.
How Planisware supports this
- Structured capture of benefits and costs: Project information on effort and expected outcomes is stored centrally.
- Compare projects by economics: Portfolios can be sorted by benefits, effort, or economic indicators.
- Support portfolio prioritization: ROI-based decisions feed into evaluating and selecting strategically relevant initiatives.
Cost Performance Index (CPI) and budget variance
CPI and budget variance show whether projects remain within the planned cost baseline and how efficiently resources are being used. They highlight where financial risks are emerging.
How Planisware supports this
- Central capture of cost and effort: Project cost data is held in a consistent structure and can be compared transparently.
- Early detection of variances: Portfolio and project views quickly expose cost trends and outliers.
- Support prioritization: Projects can be reassessed or replanned based on economic criteria.
Image
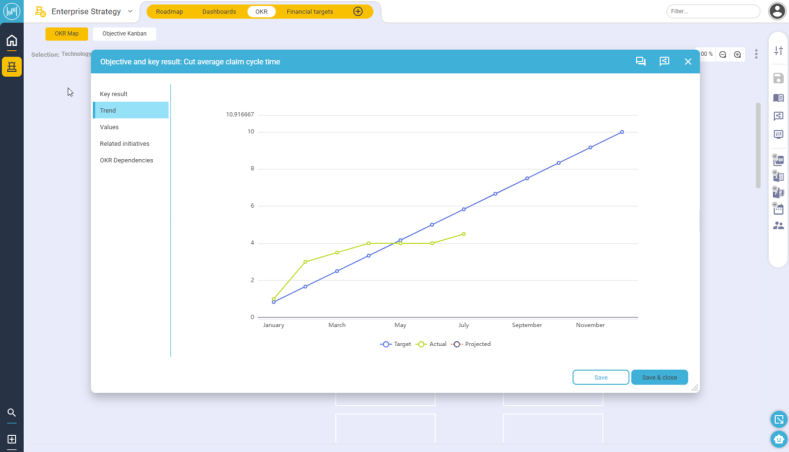
Schedule variance and on-time completion
Schedule variances indicate whether projects are on track against the planned timeline. The share of projects completed on time (“on-time completion”) provides a quick view of schedule reliability across the portfolio.
How Planisware supports this
- Central schedule overview: Key dates, milestones, and delays are visible in a single view.
- Early risk detection: Deviations from the schedule are clearly flagged so teams can react in time.
- Clear portfolio views: Management and teams quickly see which projects are becoming critical and where reprioritization or replanning is needed.
- Filterable status lists: Project lists can be sorted by status, priority, or time criticality to spot bottlenecks faster.
Resource utilization and capacity planning
Resource utilization shows how well available capacity is being used and where overload occurs. A balanced workload improves delivery capability, quality, and team satisfaction.
How Planisware supports this
- Transparent capacity views: Teams see early where resources are tight and which projects are affected.
- Utilization overview: Allocated versus available capacity is easy to compare at project, team, or portfolio level.
- Support for prioritization: Bottlenecks reveal which initiatives must be staggered or reprioritized.
- Scenario comparison: Different planning variants help find the best sequence for initiatives.
Customer satisfaction and stakeholder acceptance
Customer satisfaction (for example, CSAT) and stakeholder acceptance show how well project outcomes meet expectations. They indicate whether collaboration, communication, and deliverables are convincing.
How Planisware supports this
- Capture feedback directly in the tool: For example, simple ratings (e.g., 1–5 stars) and comments can be entered after project milestones. External users can be granted limited access to a single feedback form.
- Transparent feedback: Teams see clearly where expectations were met and where improvements are needed.
- Portfolio views support decisions: Projects can be sorted by satisfaction scores to identify where support or quality focus is required.
Image
PMO maturity
The PMO maturity level describes how professional and effective the PMO organization is. Typical stages range from initial ad-hoc processes to fully integrated, strategically aligned portfolio governance.
Typical maturity levels
- Nascent: Inconsistent data, unclear processes, little standardization.
- Structured: Established governance, defined roles, and basic KPIs.
- Advanced: Integrated portfolio management, clear decision structures, and true outcome focus.
How Planisware supports this
- Structured maturity assessment: Governance standards, roles, and processes are modeled centrally and compared over time.
- Make PMO evolution visible: Dashboards show progress in transparency, standardization, and portfolio steering.
- Build roadmaps: Planisware helps prioritize improvement actions and systematically increase PMO maturity.
Prioritizing and automating KPIs to increase PMO value
Example governance workflow
| Role | Frequency | Results / deliverables |
|---|---|---|
| Project manager | Weekly | Status report |
| PMO | Monthly | Portfolio overview (benefits, alignment, ROI) |
| Executive board | Quarterly | Strategy and performance review |
How Planisware supports this
- Central data foundation: Project data is captured consistently and made available in role-specific views.
- Standardized reports: Status and portfolio views are easily refreshed on a regular cadence to support decision-making.
- Clear prioritization: KPIs feed into portfolio scoring so critical initiatives stand out.
- Governance support: Structures, roles, and reporting cycles are modeled in Planisware and embedded in daily work.
Image
Frequently asked questions
Which KPIs are best to measure PMO success?
The most important KPIs are Benefits Realization, Strategic Alignment, ROI, cost and schedule performance, resource utilization, risk response time, stakeholder satisfaction, quality metrics, and PMO maturity.
How can a PMO sensibly prioritize and update its KPIs?
Select a maximum of eight KPIs that contribute directly to corporate strategy and review them monthly with thresholds and predefined response actions.
How can stakeholder satisfaction be captured and used effectively?
Standardized short surveys and feedback loops in the tool deliver actionable CSAT scores that feed directly into prioritization and continuous improvement measures.