Product development visibility ensures that every stakeholder—from engineering to marketing to executives—can clearly see status, risks, and rationales throughout the lifecycle of a product.
When visibility is embedded in daily work, teams move faster, identify risk earlier, and make stronger, data-driven decisions. This article explores seven practical tactics that increase product transparency and alignment, enabling organisations to accelerate delivery and strengthen stakeholder confidence.
Strategic Overview
When visibility gaps exist in product development, misaligned roadmaps, redundant work and slow decision cycles follow. When product data, progress and rationale are transparent, organisations can multiply their speed-to-market.
The following seven tactics are proven to make each phase—from ideation through delivery—more measurable and reliable:
| # | Tactic | Primary Outcome |
|---|---|---|
| 1 | Sync roadmaps to execution with Jira | Ensures alignment between strategy and actual work |
| 2 | Publish role-tailored reports | Keeps every stakeholder informed efficiently |
| 3 | Instrument product analytics & session replay | Links customer behaviour directly to product decisions |
| 4 | Make prioritisation transparent with scoring models | Enables objective, auditable feature selection |
| 5 | Surface delivery health via dashboards | Reveals risks before they slow teams down |
| 6 | Add product observability for release impact | Improves reliability by linking code to customer outcomes |
| 7 | Close the feedback loop with request scoring | Builds trust through transparent customer responses |
Together, these practices establish a single source of truth from planning through product performance.
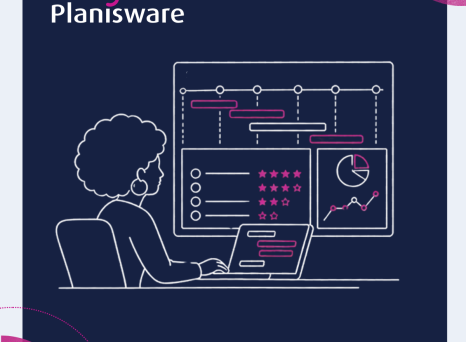
Planisware for Unified Product Lifecycle Visibility
Planisware delivers an integrated, AI-powered platform that orchestrates visibility across every phase of the product lifecycle.
Product lifecycle management (PLM) is the coordinated process of managing a product’s entire life—from ideation and initial development through launch, maturity and retirement—to maximise value while minimising risk. Planisware unifies PLM, roadmap visibility and stakeholder reporting in one secure, single-tenant cloud environment.
The platform’s strengths include scalable configurability to adapt governance across portfolios, AI-powered analytics that connect execution data to strategic KPIs and full traceability through bi-directional tool integrations and role-based reporting. With unified views and shared context, Planisware turns fragmented updates into actionable insight for decision-makers, bridging the gap between strategic intent and execution reality.
Sync Roadmaps to Execution with Jira Integration
Visibility begins with alignment between strategy and execution. Through bi-directional Jira integration, Planisware links high-level roadmaps directly to Jira epics and stories, keeping every update synchronised in both tools.
Bi-directional integration means information flows both ways—ensuring that progress in Jira automatically updates strategic plans, while changes in Planisware reflect immediately where the work is happening. This eliminates manual reconciliation, provides clear audit trails and strengthens cross-functional alignment.
Create roadmap items in Planisware, link each to a Jira epic or story, track updates in both tools in real time and report automatically against roadmaps and KPIs. As a result, stakeholders see execution reality without chasing status reports.
Publish Role-Tailored Stakeholder Reports
Not every stakeholder requires the same level of detail. Role-tailored reporting provides clarity without noise.
Pre-built templates allow teams to deliver executive summaries of roadmap progress and investment status, sprint performance reports for engineering leads, launch readiness dashboards with risk tracking for operations and prioritisation rationales for business partners.
Automated, consistent reports reduce update fatigue and ensure each audience receives relevant insights in the format that drives timely action. Within Planisware, these reports draw directly from live portfolio data, maintaining alignment from project teams to executive boards.
Instrument Product Analytics and Session Replay
Quantitative data reveals what users do; qualitative insights explain why. Combining both gives visibility into true product performance.
Product analytics refers to the structured collection and interpretation of user interaction data such as feature adoption, conversion funnels and retention cohorts. Complementing this with session replay tools lets teams observe full user journeys and identify friction points.
Integrating these insights into a unified PLM ecosystem such as Planisware clarifies which features deliver measurable value and which require refinement—advancing a more data-informed product strategy.
Make Prioritisation Transparent with Scoring Models
Feature selection often becomes contentious when rationale is not visible. Structured scoring models turn subjective debate into repeatable decision-making.
Frameworks like RICE (Reach, Impact, Confidence, Effort) or weighted models quantify how initiatives align with goals. For example:
| Metric | Score | Calculation Example |
|---|---|---|
| Reach | 500 users | Estimated reach |
| Impact | 3x | Moderate impact |
| Confidence | 70% | Data confidence |
| Effort | 2 person-months | Required resources |
| RICE Score | 525 | (500×3×0.7) ÷ 2 |
Publishing these scores builds transparency, helping stakeholders understand trade-offs and agree on priorities objectively. Planisware enables organisations to embed these scoring frameworks directly into portfolio governance workflows.
Surface Delivery Health with Performance Dashboards
Dashboards convert large amounts of delivery data into actionable metrics. A sprint dashboard, for instance, visualises planned versus actual capacity, velocity trends and bottlenecks that threaten release schedules.
Common indicators include velocity and throughput trends, story completion ratios, team capacity and load balance, and open risks or blockers. When integrated with Planisware, these metrics aggregate into portfolio-level visibility—giving teams and leadership early warnings when execution predictability begins to drift.
Add Product Observability for Release Impact Analysis
Observability extends visibility into the customer experience after code ships. Observability platforms aggregate logs, traces and metrics so teams can detect and diagnose production issues quickly.
Typical monitored metrics include error and failure rates, API latency and uptime, and post-release incident frequency. By linking these signals to product changes, organisations quantify release impact and identify degradation early. Integrating these insights into Planisware connects operational performance back to strategic outcomes, reinforcing traceability from code to customer value.
Close the Feedback Loop with Customer Request Scoring
Visibility also includes the customer voice. A structured feedback loop captures, scores and communicates progress on user requests.
Assigning each request a score based on customer value, strategic fit and technical feasibility helps teams prioritise transparently. Publicly sharing updates—through changelogs, release notes or dashboards—demonstrates accountability and enhances engagement.
Implement a feedback metric in your chosen tool, score top customer requests monthly and publish progress summaries every release cycle. Within Planisware, this feedback can feed directly into prioritisation frameworks, ensuring customer input influences strategy and delivery.
Frequently Asked Questions
What does product development visibility mean and why does it matter?
Product development visibility ensures all stakeholders can track progress, risks and decisions throughout the lifecycle, improving alignment and confidence in outcomes.
How do I know if my product development process is visible enough?
If teams and leaders can access real-time updates, roadmaps and decision rationale in a central platform like Planisware, your visibility maturity is strong.
Which visibility tactic should I implement first with limited resources?
Start with roadmap–execution , as it immediately clarifies work status across teams with minimal setup effort.
How can I measure the success of visibility improvements?
Track metrics such as reduced cycle times, fewer reopened issues and higher stakeholder satisfaction.
How often should I update stakeholders on product development progress?
Provide concise, role-based reports at each sprint or major milestone to maintain alignment without overloading audiences.
Visibility is not a single tool—it is a discipline connecting every layer of product work. Embedding these seven tactics into your operating model creates a culture of clarity and accountability, where data drives decisions and strategy advances in step with execution. Planisware supports that alignment with a unified platform that links every product decision back to measurable business value.